Introduction to Financial Modeling Session
Drexel University
The Introduction to Financial Modeling session is a live meeting which gives participants an overview of financial modeling and demonstrates how to use a model to create a unique forecast by changing the key inputs. This page contains all the details you will need for the session: The slides, example model, and dial-in information. Please note that the model provided and all other files and information on our website are for demonstration and education purposes only, and do not represent investment advice. Please refer to our Terms of Use for additional details.
To Access the Meeting:
Video call link: https://meet.google.com/ncr-rfqr-rma
Or dial: (US) +1 262-355-8476 PIN: 731 591 354#
Video call link: https://meet.google.com/ncr-rfqr-rma
Or dial: (US) +1 262-355-8476 PIN: 731 591 354#
|
| ||||
Additional Resources
The Intro to Modeling discussion is designed to be a high-level overview of what modeling is, in the context of equity research. For those interested in digging deeper, I suggest attempting to create your own forecast in the example SBUX model before the company reports earnings next week (on May 2nd). You can perform the following steps to create a unique forecast:
- Review the "Opinion Template" and pick one or two ideas which resonate with you.
- Convert your opinions from Step 1 into a thesis using the "Forecast Thesis" template as a guide.
- Open the Example Starbucks model and click on the "IS (adjusted)" worksheet. This is where you will make your adjustments. Focus on the blue input cells. Adjust the blue cells based on the forecast thesis you developed in Steps 1 and 2.
- If you would like additional details on how the example model was built, or how to adjust the input cells to create a unique forecast, refer to the excerpts from the book The Procrastinator's Guide to Financial Modeling below.
- On the night of the Starbucks earnings release (May 2nd) check how close your forecast was to the reported results.
|
| ||||
|
| ||||
Follow-up Point From Our Meeting
On the call we discussed how the market's interest rate expectations differ from that of the Fed, and that you can use the pricing of Fed Funds futures contracts to determine what the market has already priced in for interest rates. Here is an excerpt from my book which is explains how that calculation works:
|
Federal Fund futures are actively traded on the Chicago Mercantile Exchange (CME). You could look to the futures contracts to determine the probability of a future rate change. To do this take the Federal Funds future price for the most recent month and subtract it from 100. For example, assume that it is July 1st, the current Federal Funds rate is 2.40%, and the FOMC will meet in the middle of this month. If the July 31st Federal Funds future contract price is 97.85, this would imply an expected Federal Funds rate of 2.15%, or 100 – 97.85. The current Federal Funds rate in this example is 25 basis points higher compared to the rate implied by the futures contract (2.40% versus 2.15%). This implies that the market expects a 25 basis point decrease in the target Federal Funds rate at the next FOMC meeting.
To calculate a rough estimate of the implied probability of a rate change, take the difference between the rate implied by the futures contract and the current rate, and divide it by the difference in the expected rate if the FOMC were to change the rate, from the current rate. In our example this would be (2.15% - 2.40%) ÷ (2.15% - 2.40%) = 100 percent probability of a rate cut based on the market’s pricing of futures contracts. This is a simplified approximation. The CME publishes a probability distribution of rate increases based on future prices which is far more precise. |
On the call I also mentioned the tool that the CME Group maintains to track the full probability distribution of the market's expectations. Here is the link to the tool: CME FedWatch Tool. To use it click on the date you are interested in. For example, if you are interested in comparing what the market has priced in for the end of 2023 to compare it to the Fed's expectations click on "13 Dec23". This will show a probability distribution of the market's expectations for the December 13, 2023 FOMC meeting which is on December 13th (refer to the calendar here). The distribution will look like this:
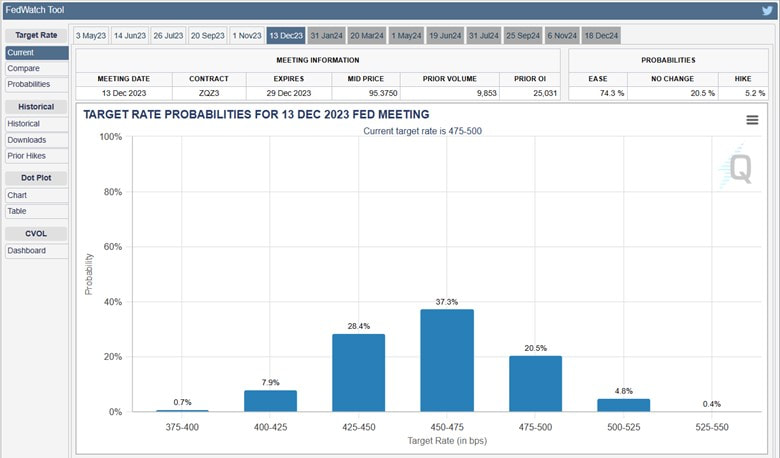
To get the full distribution quoted in one "Expected" rate range you can multiply the midpoint of each range in the distribution by its probability and sum the result. Which is:
0.7% * [(375+400)/2] + 7.9% * [(400+425)/2] + 28.4% * [(425+450)/2] + 37.3% * [(450+475)/2] + 20.5% * [(475+500)/2] + 4.8% * [(500+525)/2] + 0.4% * [(525+550)/2] = 4.59% You can interpret this as the rate the market expects at the end of December 2023.
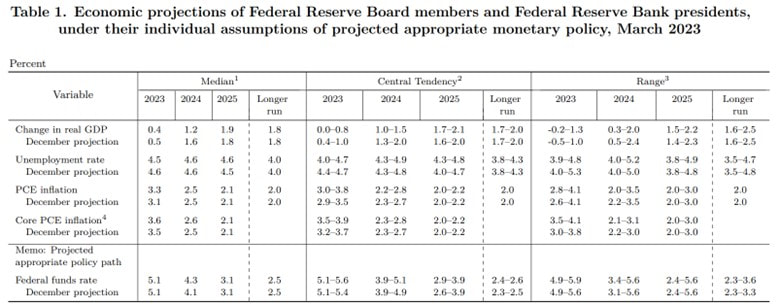
If you would like to compare this to what the Fed expects, go to the last Summary of Economic Projections published by the FOMC. Note that the expected Fed Funds rate (last line in the table) for 2023 is 5.1%. This is what the FOMC members of the Fed expect the Fed Funds rate to be at the end of 2023. So, the market is pricing in a lower rate (4.59%) compared to the Fed expectations (5.1%).