Overview: This page is a step-by-step guide of how to input your own assumptions into our Netflix Earnings Model. Remember none of the cells in our models are locked, so you are free to change the model however you wish, however, it is much easier to stick to the primary assumption cells shaded in blue. Be sure to download the model (click to download) and follow along.
Remember: All of our models use the same color code. Blue cells represent our primary assumptions, purple cells indicate the value was calibrated to meet management's guidance, and orange cells represent consensus estimates. Columns with dark gray headings represent historic results, and light gray headings indicate future period estimates.
Keep in Mind: All models change over time as new information is released. The images and values shown on this page may be out-of-date, but remember this page is designed to demonstrate the model's methodology, which in general does not change. To see our latest estimates download the model from our model page.
Netflix Model Basics: Our Netflix model breaks-down the company's earnings into three segments: Domestic Streaming, International Streaming, and DVD. For each segment we estimate the growth in users and revenue per user, and multiply these two metrics to arrive at total revenue. In this demonstration we will show how to change the assumptions for each segment.
Step 1 - Domestic Streaming Segment (Next Quarter): There are four metrics we use to project Domestic Streaming earnings: 1) Paid member growth Quarter-over-Quarter, 2) revenue per average paid member, 3) gross margin, and 4) marketing expense per paid member.
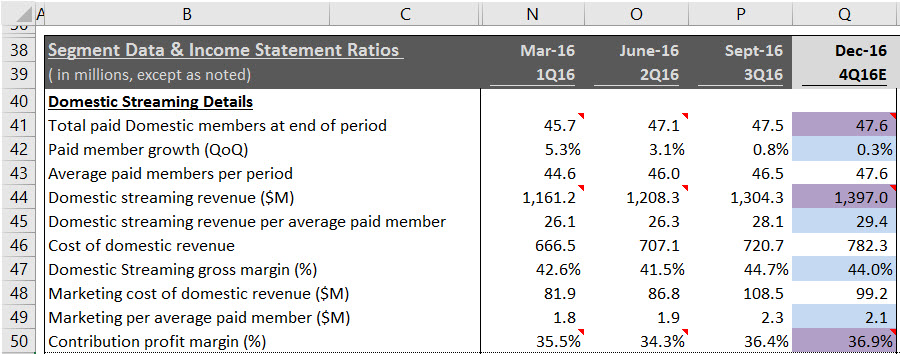
Step 1a - Domestic Streaming Revenue: To project revenue for the segment we start by estimating the revenue per average member in cell Q45. We use historic trends and the result from the prior quarter to shape our forecast. In the example above we selected $29.40 which means we expect Netflix to earn $29.40 on average from each of their subscribers over the three month period ending December 31, 2016.
Next we estimate the total growth in members over the period, which we set at 0.3% Quarter-over-Quarter. We backed into this number to get to management's guidance of 47.6M subscribers. Now that we have the total average members and revenue per member, we can multiply to two metrics to get to revenue for the Domestic Streaming Segment (the calculation is in cell Q44). To incorporate your assumptions, change the estimates in rows 42 and 45.
Next we estimate the total growth in members over the period, which we set at 0.3% Quarter-over-Quarter. We backed into this number to get to management's guidance of 47.6M subscribers. Now that we have the total average members and revenue per member, we can multiply to two metrics to get to revenue for the Domestic Streaming Segment (the calculation is in cell Q44). To incorporate your assumptions, change the estimates in rows 42 and 45.
Step 1b - Segment Margin: Next we estimate the gross margin for the segment which we base on historic results (44% in cell Q47). We also estimate the marketing expense per average paid member in cell Q49. These estimates drive the total contribution margin for the segment in cell Q50. To incorporate your assumptions, change the estimates in rows 47.
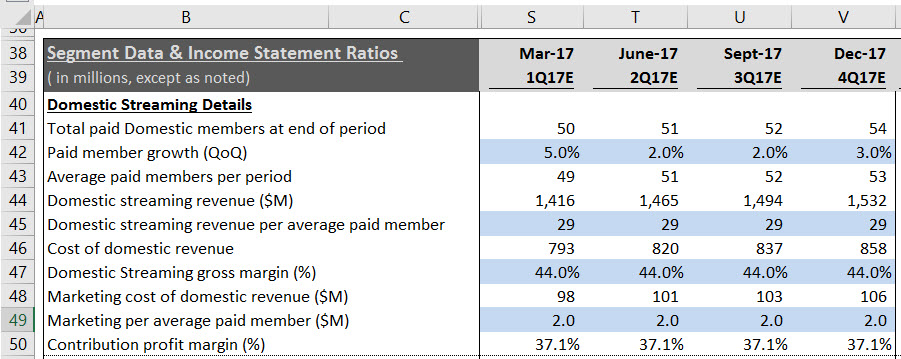
Step 2 - Domestic Streaming Segment (Next Few Years): After you understand how the estimates work for the next quarter you can easily replicate the inputs in the next few quarters or years. To decide what estimates you would like to plug in, look at the historic trends. If earnings fluctuate with the calendar quarters then introduce seasonality into the model by increasing or decreasing the growth rates and margins. If there is a new product launch approaching consider how you would expect it to impact results.
The image below shows our assumptions for 2017. We kept the average revenue per member, gross margin, and marketing expense in-line with our estimates for the fourth quarter of 2017. To incorporate your assumptions, change the estimates in rows 42, 45, 47, and/or 49.
The image below shows our assumptions for 2017. We kept the average revenue per member, gross margin, and marketing expense in-line with our estimates for the fourth quarter of 2017. To incorporate your assumptions, change the estimates in rows 42, 45, 47, and/or 49.
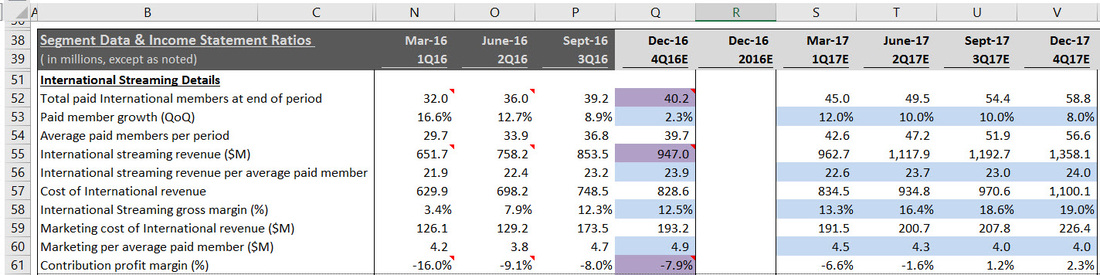
Step 3 - International Streaming Segment: We use the same methodology for the International Streaming Segment as we do for Domestic, except our estimates are a bit different. The image below shows that we have calibrated the fourth quarter to meet management's guidance. We assume the growth rate in International members, revenue per member, and gross margin will increase in 2017, and the marketing expense per member will decrease. To incorporate your assumptions, change the estimates in rows 53, 56, 58, and/or 60.
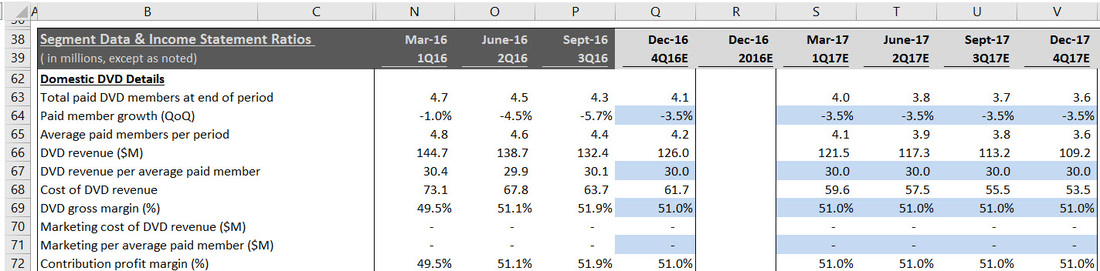
Step 4 - DVD Segment: Netflix' DVD Segment has been in decline and has not been a meaningful contributor to overall earnings. We project similar decline in our future period forecast. To incorporate your assumptions, change the estimates in rows 64, 67, 69, and/or 71.
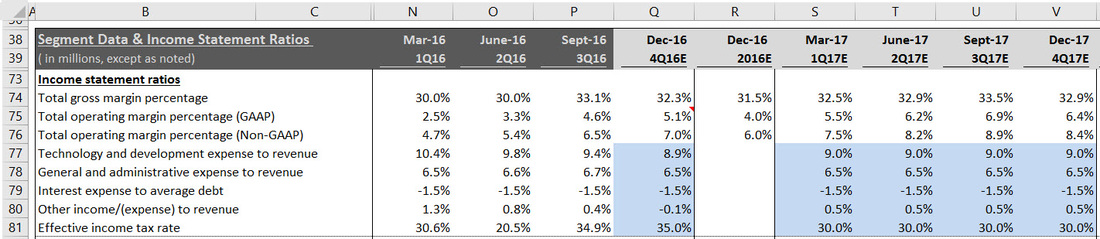
Step 5 - Remaining Income Statement Assumptions: Our model will bring the revenue and contribution margin assumptions from the segment section up to the Income Statement automatically, but there are five more assumptions that must be made to finish the Income Statement: 1) Technology & Development expense as a percentage of revenue, 2) General & Administrative Expense as a percentage of revenue, 3) Interest Expense to average debt, 4) Other Income to revenue, and 5) Effective tax rate. You can use historic results to project the ratios in future periods. To incorporate your assumptions, change the estimates in rows 77, 78, 79, 80, and/or 81.
Step 6 - Analyze Your Results: After completing steps one through five you will have your own complete earnings model. You may also change the Balance Sheet and Cash Flow Statement assumptions, or the share valuation estimates. If you would like to share your results with our community, submit it using the form on this page with either a summary of the changes you made or an article and we will post it on our website.