Overview: This page is a step-by-step guide of how to input your own assumptions into our Starbucks (NASDAQ:SBUX) Earnings Model. Remember none of the cells in our models are locked, so you are free to change the model however you wish, however, it is much easier to stick to the primary assumption cells shaded in blue. Be sure to download the model (click to download) and follow along.
Remember: All of our models use the same color code. Blue cells represent our primary assumptions, purple cells indicate the value was calibrated to meet management's guidance, and orange cells represent consensus estimates. Columns with dark gray headings represent historic results, and light gray headings indicate future period estimates.
Keep in Mind: All models change over time as new information is released. The images and values shown on this page may be out-of-date, but remember this page is designed to demonstrate the model's methodology, which in general does not change. To see our latest estimates download the model from our model page.
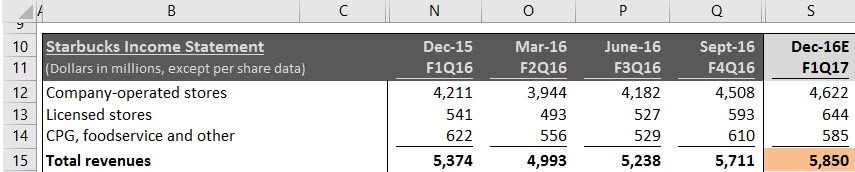
Step 1 - Get Familiar With the Model Layout: Starbucks is a bit different from our other models because the company does not follow a calendar year reporting cycle, so their year ends in September instead of December. This model demo was written prior to Starbucks' December quarter release (fiscal first quarter). To indicate that the December quarter represents future period estimates we have shaded column S light gray. The dark gray columns prior to the December quarter represent historic results.
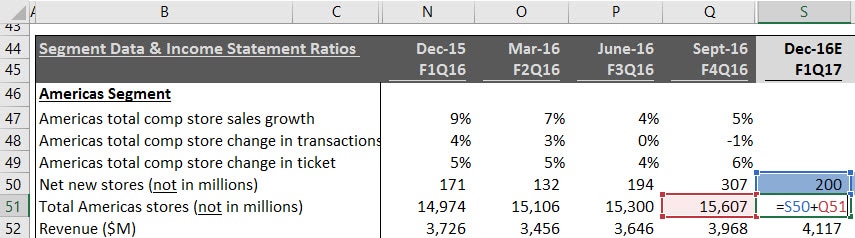
Step 2 - Enter Estimates of New Stores for Each Region: Starbucks' management typically gives their forecast of new stores by region on the earnings conference calls. We divide the guided stores by the number of quarters remaining in the year, and enter it in the blue cells in row 50. The equations in row 51 simply add the new store estimates to the last reported store count to arrive at the total foretasted store count for each region.
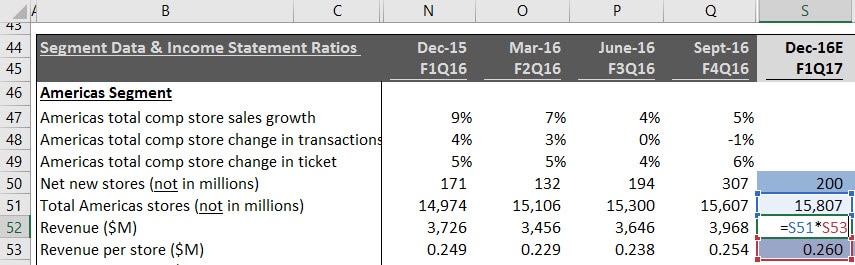
Step 3 - Enter Estimate of Revenue Per Store: Revenue per store represents a simplified version of comp store sales, since it does not take into account the time a store has been operational. The historic ratio simply divides total segment revenue by the number of segment stores. Then we use historic results and typical seasonality to project revenue per store in the future periods. For example in cell S53 we estimated average revenue per store in the Americas segment of $260,000. This is higher then the $249,000 of the December quarter last year, to reflect our expectation of an improvement in year-over-year sales. It is also higher then the September quarter to reflect the typical seasonality (December quarter sales at Starbucks typically outperform that of the other quarters). To enter your own assumptions change the blue cells in row 53, and the corresponding cells for the other segments. The equation in cell S52 will multiply your estimate of revenue per store, by the total store count estimate to derive the total revenue for the segment.
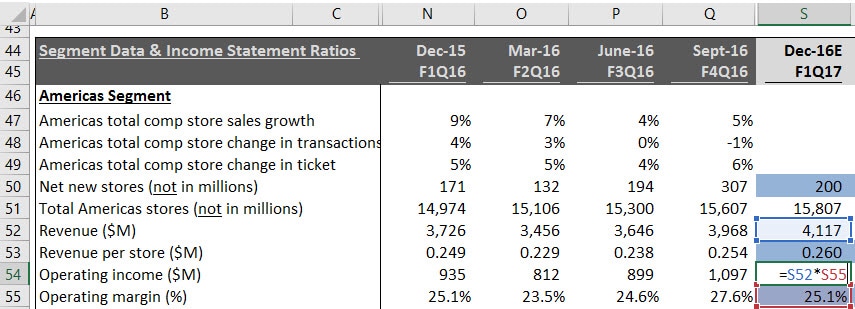
Step 4 - Enter Segment Operating Margin Estimates: Management typically gives guidance for segment operating margin for the full year. You can enter your margin estimates to be in-line with management's guidance, or base your assumptions on some other factors, and enter your estimates in row 55. The equation in cell S54 will then multiply your estimated segment revenue (from Step 3), and your operating margin percentage in cell S55 to derive the operating margin in dollars.
Step 5 - Repeat Steps for Each Segment: Starbucks has five segments: Americas, EMEA, China/Asia Pacific, Channel Development, and All Other. The revenue and operating margin methodology in our model is relatively consistent for each segment, so all you need to do is replicate Steps 2 through 4 to complete the segment estimates. The total revenue from the segment section will flow up to the Income Statement, and automatically allocate to the three revenue sub-categories.
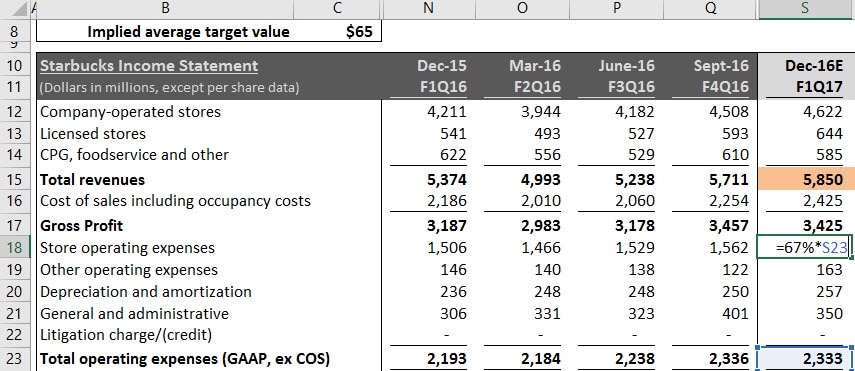
Since we make assumptions for each segment's operating margin, the Income Statement will pull these assumptions and complete the rows down to the operating income line, by backing into the total operating expenses as the sum of the individual segments. We then allocate the expense to each line item based on historic averages. For example in cell S18, we allocate 67% of the total operating expense calculated in cell S23.
Since we make assumptions for each segment's operating margin, the Income Statement will pull these assumptions and complete the rows down to the operating income line, by backing into the total operating expenses as the sum of the individual segments. We then allocate the expense to each line item based on historic averages. For example in cell S18, we allocate 67% of the total operating expense calculated in cell S23.
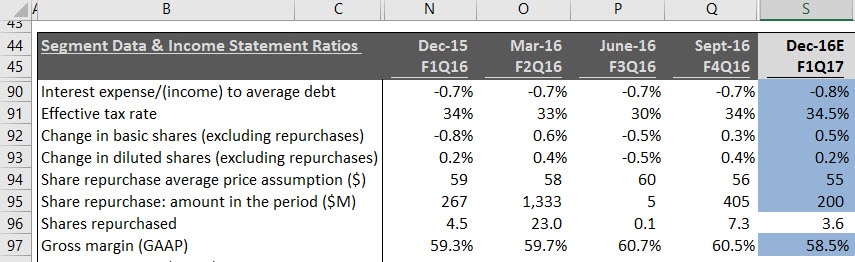
Step 6a - Complete the Income Statement: We use basic ratio analysis to complete the GAAP Income Statement with assumptions for gross margin, and interest expense to average debt. For tax expense we apply an effective tax rate to pre-tax income, and apply a historic average for earnings to participating securities. Starbucks repurchases shares each quarter. To estimate share count, we include assumptions for the average repurchase price and total dollar amount of repurchases, and apply consistent share count changes similar to those observed in recent quarters.
Step 6b - Complete the Income Statement: The assumptions we made in Step 6a will automatically fill in the remaining GAAP values in the Income Statement all the way down to Earnings Per Share.
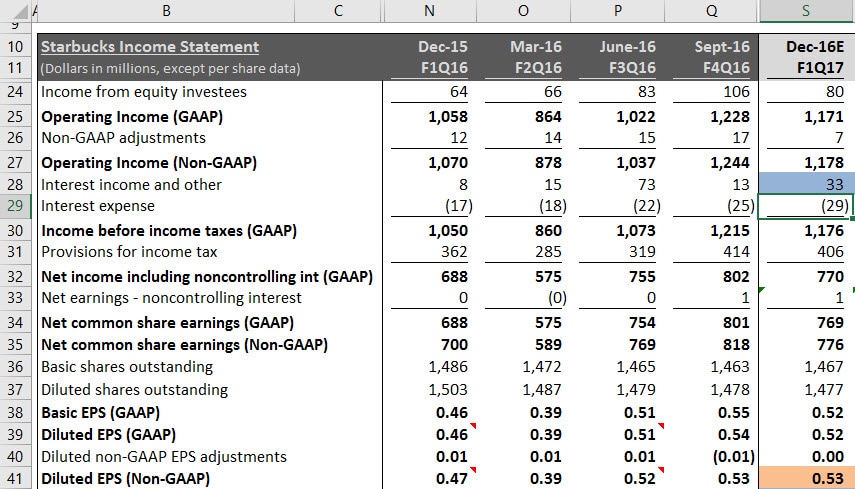
Step 7 - Non-GAAP Adjustments: Starbucks does disclose non-GAAP adjustments for the amortization expense of acquired intangibles related to Starbucks Japan, however, the adjustments are not typically significant.
Step 7 - Analyze Your Results: After completing Steps 1 through 7 you will have your own complete earnings model. You may also change the Balance Sheet and Cash Flow Statement assumptions, or the share valuation estimates. If you would like to share your results with our community, submit it using the form on this page with either a summary of the changes you made or an article, and we will post it on our website.