Facebook Inc (NASDAQ:FB) Model Demonstration |
Overview: This page is a step-by-step guide of how to input your own assumptions into our Facebook Earnings Model. Remember none of the cells in our models are locked, so you are free to change the model however you wish, however, it is much easier to stick to the primary assumption cells shaded in blue. Be sure to download the model (click to download) and follow along.
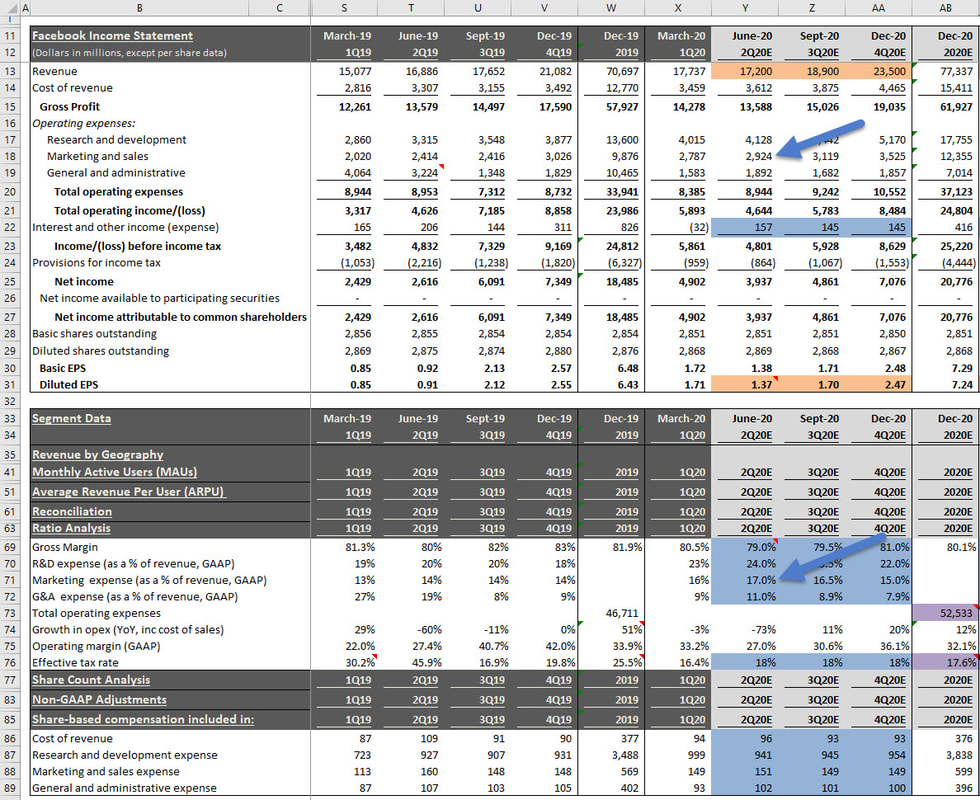
Remember: All of our models use the same color code. Blue cells represent our primary assumptions, purple cells indicate the value was calibrated to meet management's guidance, and orange cells represent consensus estimates. Columns with dark gray headings represent historic results, and light gray headings indicate future period estimates.
Keep in Mind: All models change over time as new information is released. The images and values shown on this page may be out-of-date, but remember this page is designed to demonstrate the model's methodology, which in general does not change. To see our latest estimates download the model from our model page.
Facebook Model Basics: This model uses Monthly Active User (MAU) growth rates and Average Revenue Per User (ARPU) to project future Revenue. We have also added a section for our users to make assumptions about Oculus Rift sales, although this product is not a meaningful contributor to earnings yet.
Step 1 - Estimate Monthly Active Users (MAU): We use quarter-over-quarter growth rates to project MAUs by region. To change the number of active users, you can input your own growth rate assumptions in rows 55 though 58. Remember the light gray heading indicates that the column is a future period forecast, and dark gray represent historic results. This demo was written prior to Facebook's fourth quarter 2016 release, hence column Q represents the start of our forecast period.
Step 2 - Estimate Quarterly Average Revenue Per User (ARPU): Our estimates for ARPU are entered as $/MAU and are stated on a quarterly basis. For example, during the September quarter Facebook earned $16.65 on average per user in the U.S./Canada region (cell P61 below). We incorporate seasonality into our assumption and price per ad trends. You can change the assumptions by inputting values in the blue cells in rows 61 through 64.
Step 3 - Revenue Calculation: The Excel equations will automatically multiply the MAU by the ARPU for each region, add the total, and bring it to the Revenue line at the top of the Income Statement in row 12.
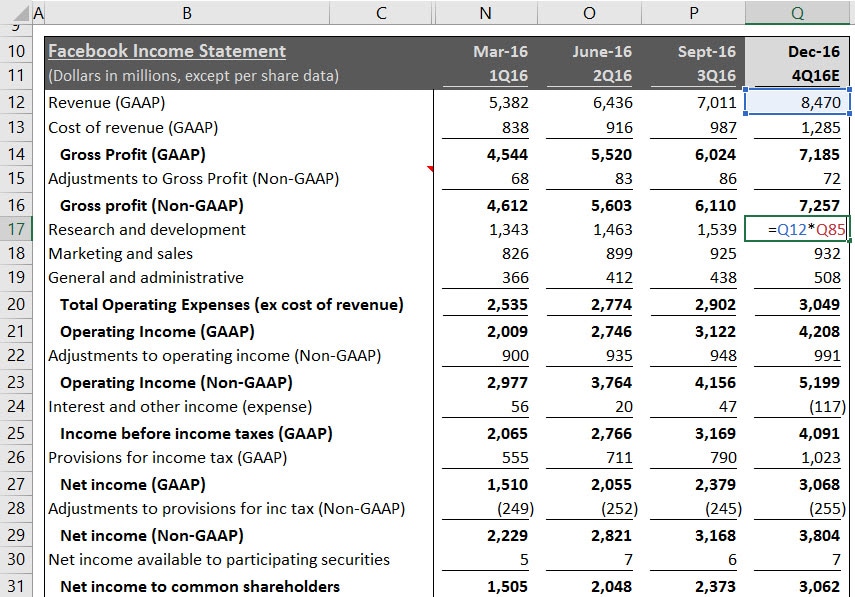
Step 4a - Complete the Income Statement: We use basic ratio analysis to complete the GAAP Income Statement with assumptions for gross margin, R&D, Marking & Sales, G&A, and interest and other income to total revenue. For tax expense we apply an effective tax rate to pre-tax income, and apply a historic average for earnings to participating securities.
Step 4b - Complete the Income Statement: All of the assumptions we made in Step 4a will automatically fill in the remaining GAAP values in the Income Statement all the way down to Net Income. For example, next quarter's R&D expense in cell Q17 is estimated by applying the R&D percentage estimate in cell Q85 to our revenue estimate calculated in Step 3.
Step 5 - Share Count and EPS: Facebook does not currently have a share repurchase program, so our share count estimate is based on a simple growth rate. We then divide the Net Income calculated in Step 4 by the total shares outstanding to get to our final Earnings Per Share (EPS) estimate.
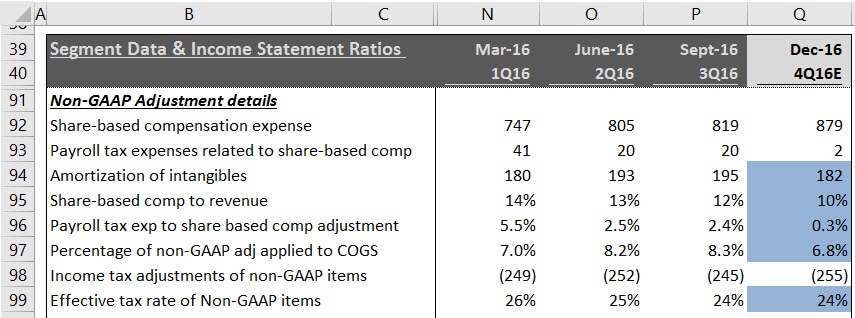
Step 6a - Non-GAAP Adjustments: Facebook discloses non-GAAP adjustments for share-based comp (including related payroll taxes), amortization of intangibles, and the tax implications of non-GAAP items. We project share-based comp using a percentage of revenue ratio, amortization based on historic averages, and tax impact based on a non-GAAP adjustment effective tax rate. You can change the non-GAAP assumptions by changing the blue cells in rows 94 through 99. Since non-GAAP adjustments are typically allocated between cost of goods sold and operating expense, we use a simple ratio in row 97 to allocate for future periods.
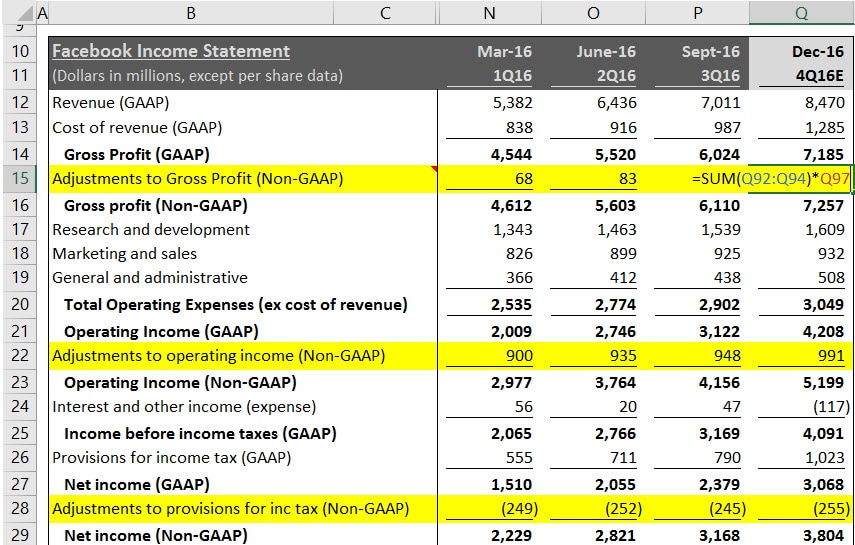
Step 6b - Non-GAAP Adjustments: The non-GAAP adjustments made in Step 6a will automatically flow through the non-GAAP Income Statement. For example, the adjustments to gross profit in cell Q15 is an equation which takes the sum of the non-GAAP adjustments estimated in cells Q92, Q93, and Q94 times the percentage allocation to cost of good sold in cell Q97.
Step 7 - Analyze Your Results: After completing Steps 1 through 6 you will have your own complete earnings model. You may also change the Balance Sheet and Cash Flow Statement assumptions, or the share valuation estimates. If you would like to share your results with our community, submit it using the form on this page with either a summary of the changes you made or an article, and we will post it on our website.


